The Radarbox Airports Page
The Radarbox Airports page has been updated over the past month with some brand-new additional features and changes. These updates range from a refreshed page layout to daily movement statistics that record the total daily inbound and outbound flights at a particular airport. We’re excited to unveil these 5 new features to you. Read on to learn more.

Image Above: Flights originating and terminating at France's Charles De Gaulle airport.
1. The Airport Flight board
The Radarbox airport flight board packs in a lot of information. Right from the time of arrival or departure to the type of aircraft, you'll fly on. We've tried to make it as informative as possible. In the revamped design, however, we've included a colorful little rectangle - the status bar. The status bar turns green, red, grey or turquoise based on the status of the flight. If the flight is late, the bar turns red and displays how late the flight is. If the flight is on time, it turns green and displays the landing or take-off time. The LIVE button at the right end of the flight board lets users track a flight right from the flight board. Interesting new additions!

Image Above: The Radarbox Arrivals Flightboard at Charles De Gaulle
2. Route Heat Maps
Airport Route heat maps convert dull route statistics and data into exciting visualizations. In essence, the route heat maps display the frequency of flights to different airports or cities from a particular originating airport. Destination airports where the frequency of flights are higher are shown in red or orange, whereas destination airports where the frequency of flights from the originating airport are lower are shown in light green or yellow.

Image Above: Route Heat Maps for Charles De Gaulle Airport
3. Movement Stats
The movement stats graph displays the 7-day average of the total number of flights that arrive or depart from a specific airport. 3 years' data is overlayed onto the graph with the timeline displayed on the X-axis while the number of flights is displayed on the Y-axis. To the right of the graph (not pictured here) is a table with a log of the total number of flights per day at the airport, thereby giving a more granular picture of the traffic the airport sees.

Graph Above: Number of flights at Charles De Gaulle Airport during 2019, 2020 & 2021.
4. Notifications, Weather & Airport Info
Supplemental information has been added to the exiting airport info card and a new notifications button has been included for alerts and reminders. Weather data on the card include data points such as temperature, visibility, and wind speed & direction. Airport info includes data such as the airport's elevation, other surrounding airports, and the local time.

Image Above: Airport Info Card
5. METAR, TAF & Airport Satellite Image
In addition to the basic weather information provided on the airport info card, such as wind & temperature, the Radarbox airport's page also displays the latest Meteorological Terminal Air Report (METAR) and Terminal aerodrome forecast (TAF) information for pilots and aviation professionals. A satellite image of the airport also serves as a helpful guide while planning flights.

Image Above: Satellite Image of Charles De Gaulle Airport
READ NEXT...
 78417
78417Tracking Helicopters With RadarBox
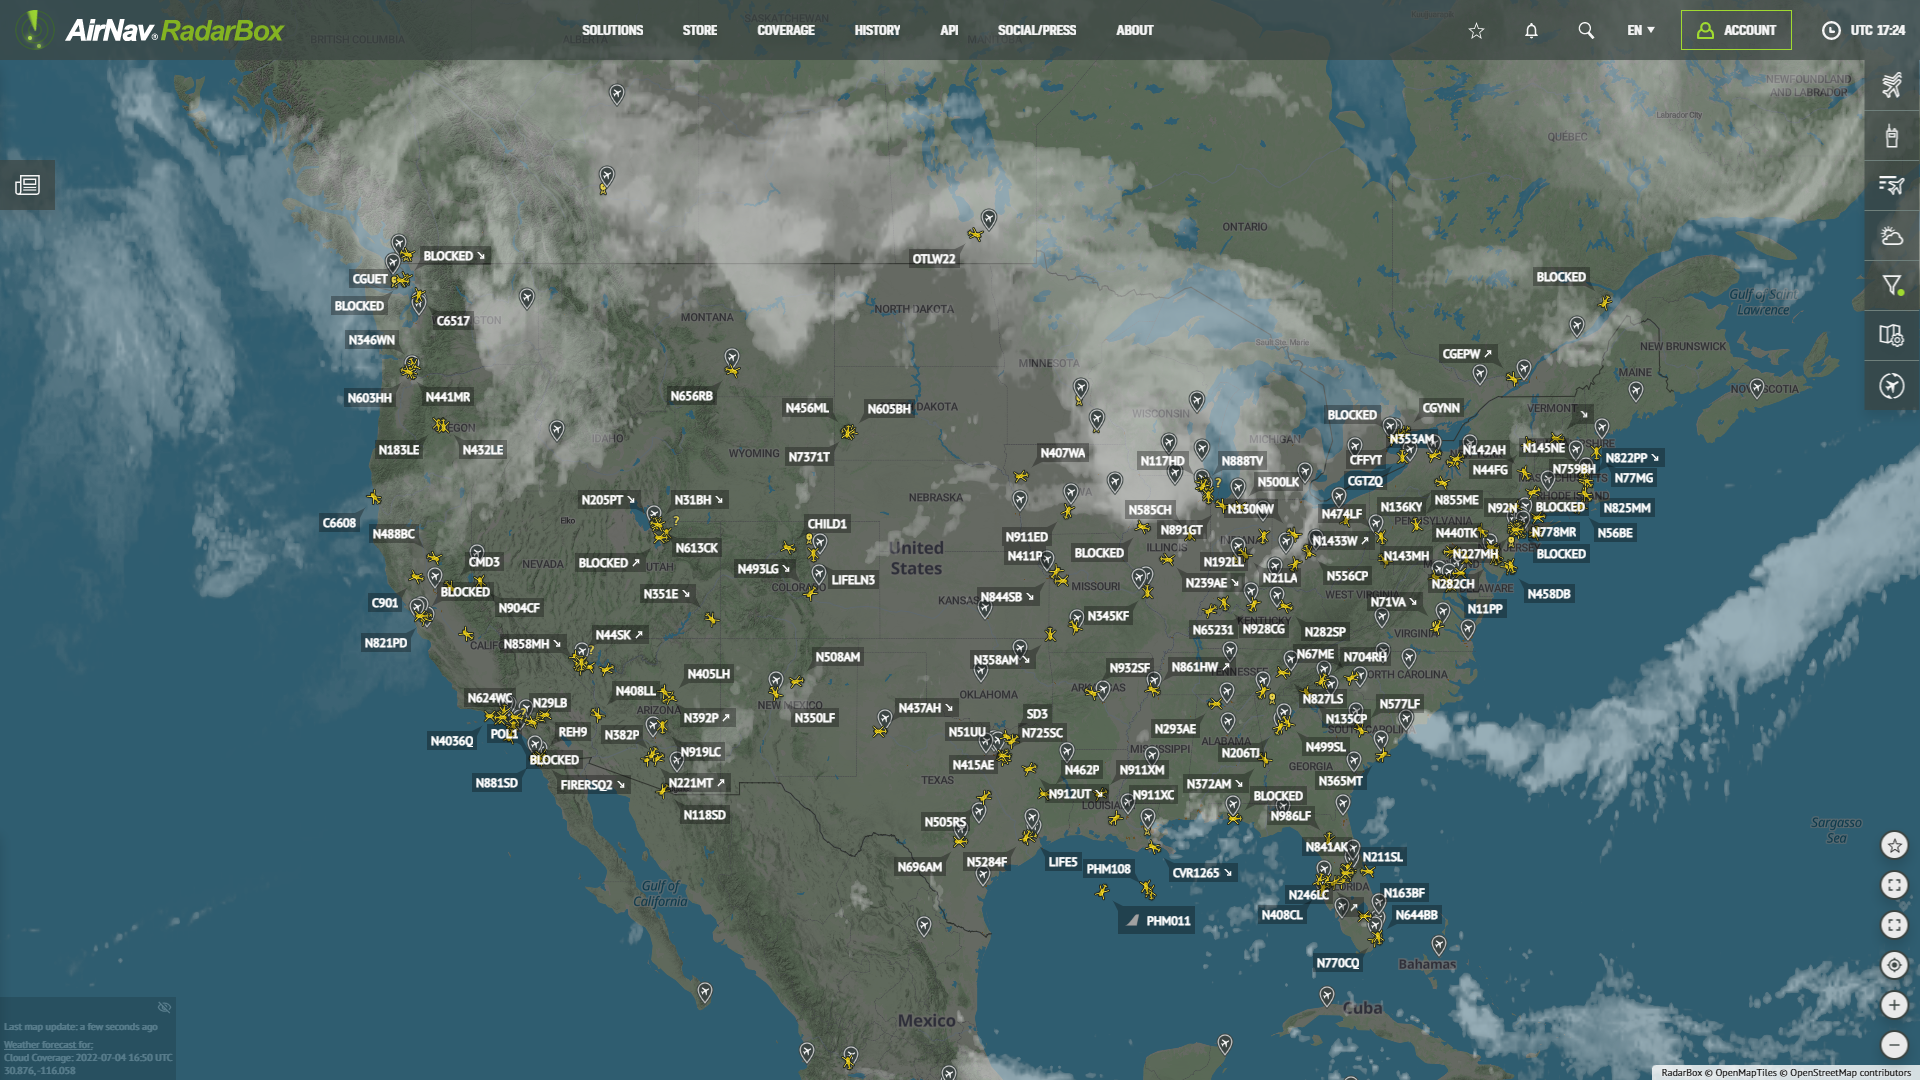
Today we'll explore how to filter and track helicopters on RadarBox.com. Read this blog post to learn more...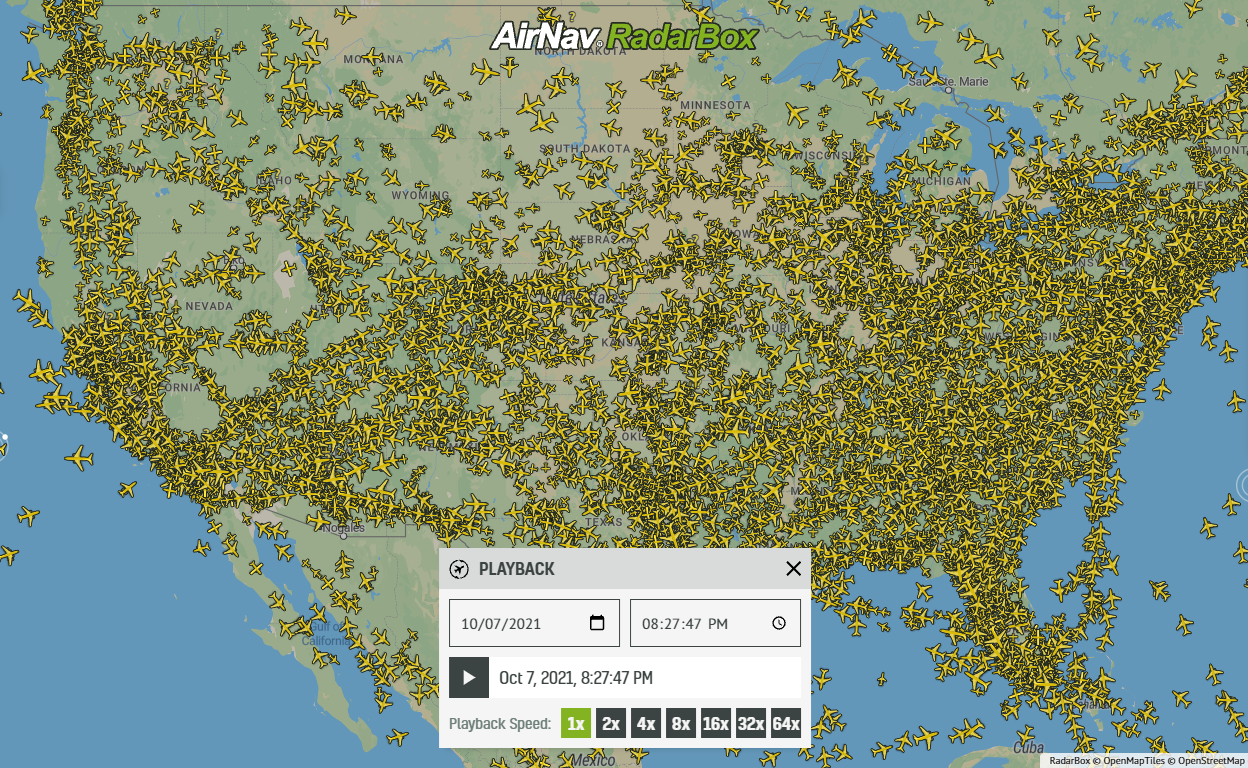 21758
21758Replay Past Flights with Playback
AirNav RadarBox officially launches the playback function on RadarBox.com, allowing users to replay the air traffic for a specific date and time in the past, within a 365-day period. Read our blog post to learn more about this feature.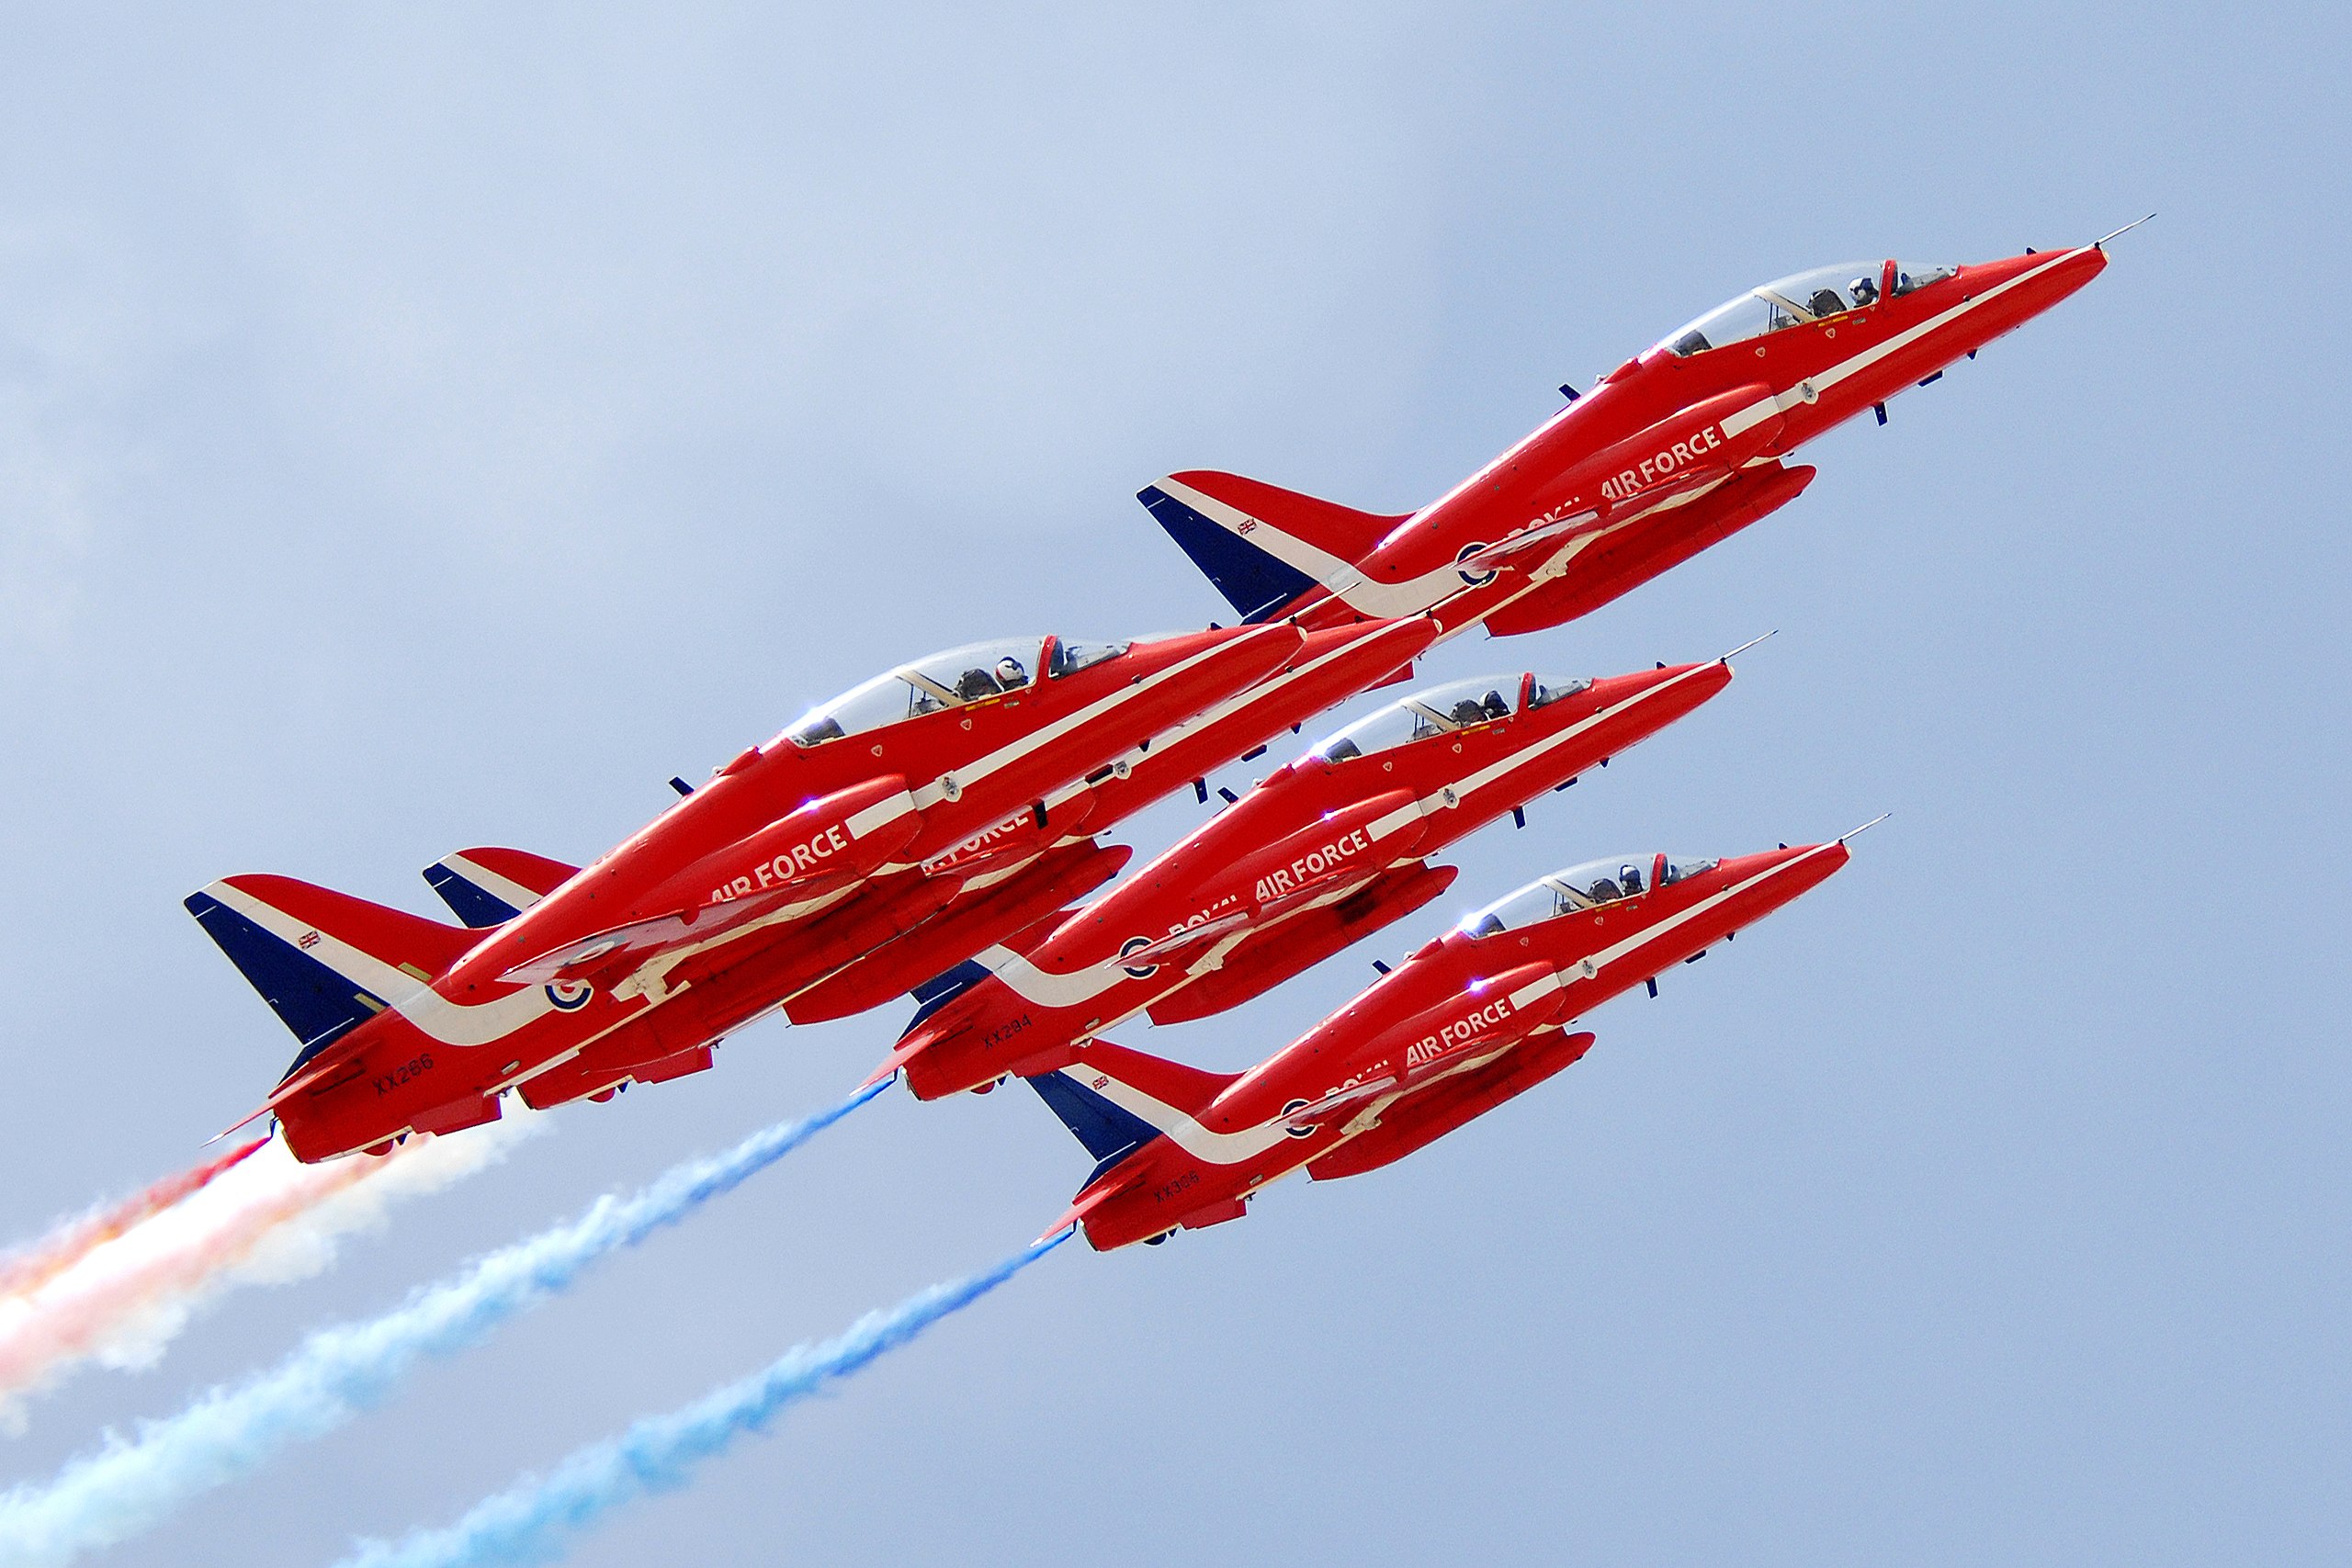 14603
14603The King's Coronation: Tracking The Red Arrows on RadarBox.com!
Ahead of the King's Coronation on Saturday in the UK, find out how you can track the Red Arrows on RadarBox.com.