ADS-B Coverage in China
Over the past 5 years, RadarBox has seen tremendous growth in ADS-B coverage all over China. We've grown from less than 10 ADS-B tracking units in 2016 to over 200 in 2021. An increase of 2300% in units, over half a decade. A phenomenal growth rate considering china's strict laws and tight regulatory oversight. As of 2021, coverage in the country is over 90% with almost all airline routes covered by either Ground-based ADS-B or Satellite-based ADS-B.
2016 vs. 2021 Coverage Comparison
The images below distinctly show the increase in coverage.
2016: 6 Chinese Airports + Hong Kong (<10% ADS-B Coverage)
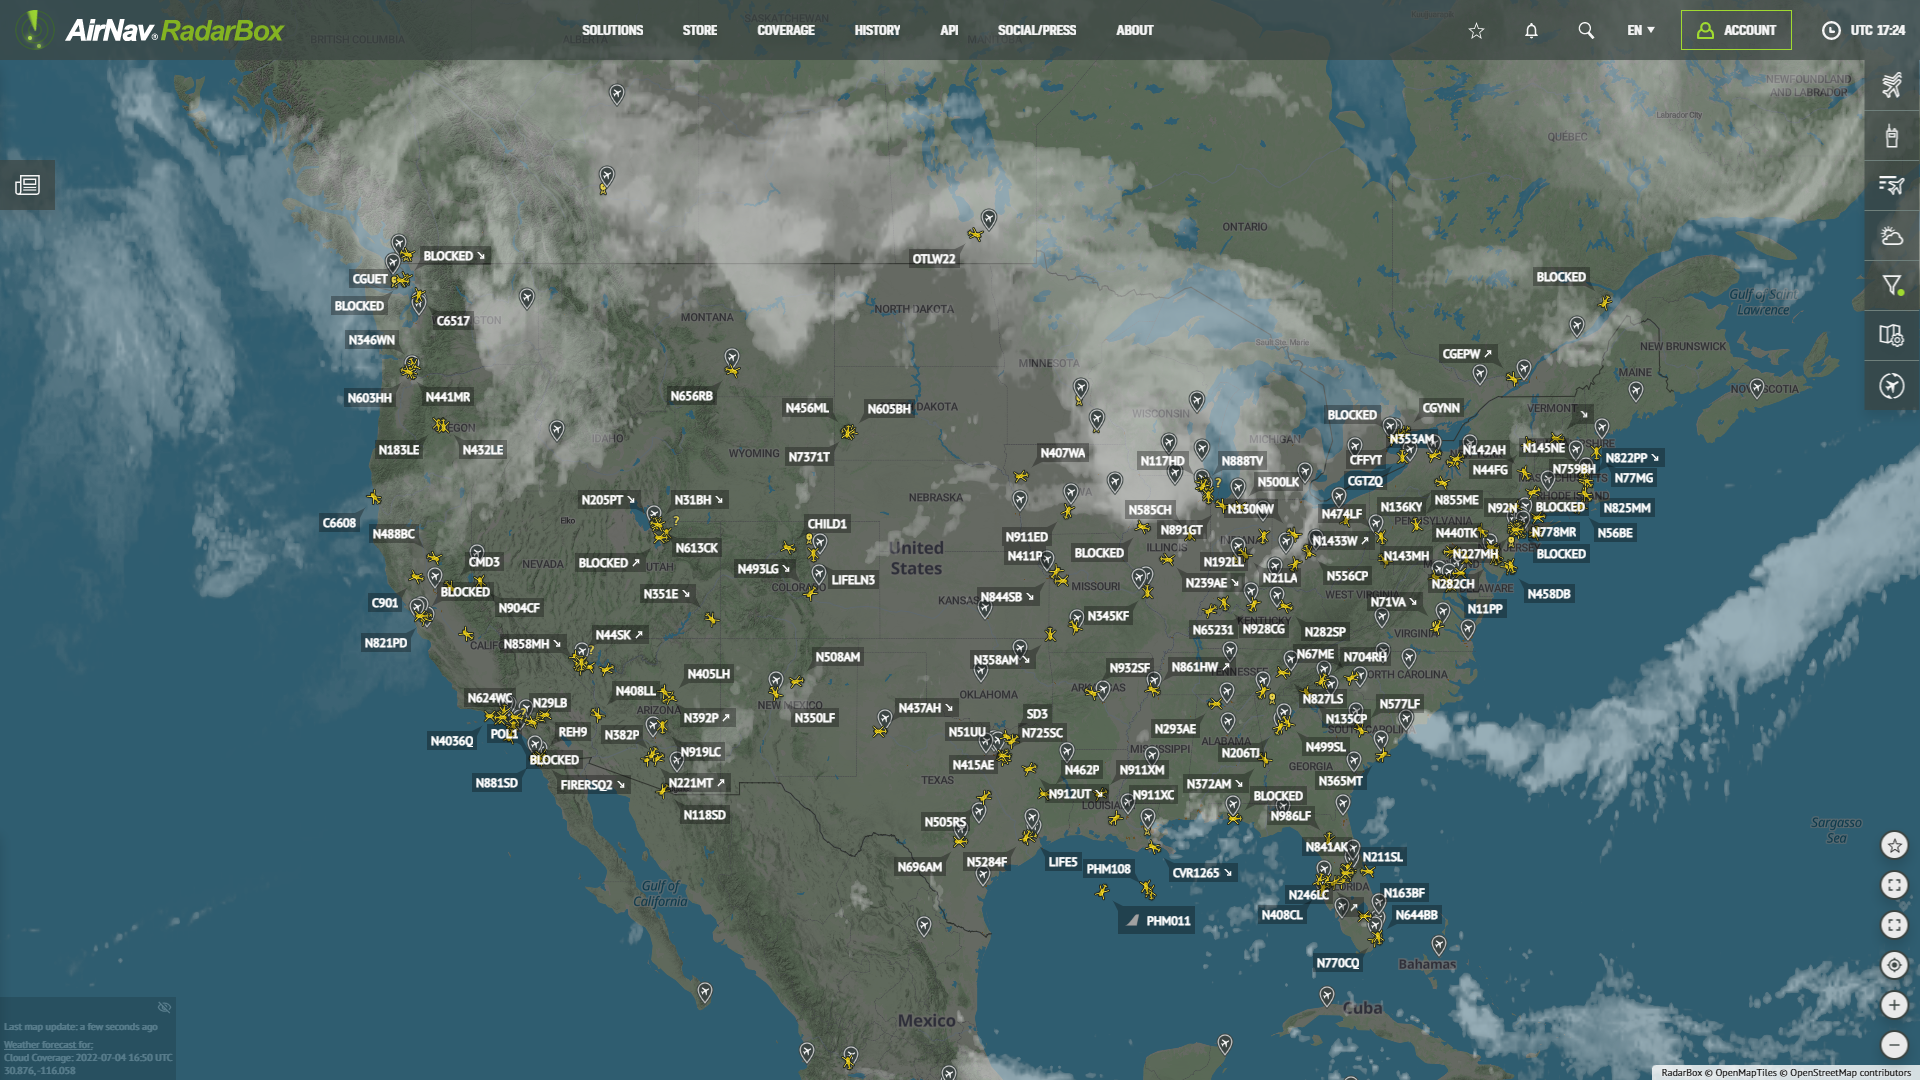
2021: 70% of Airline Routes Covered by Ground ADS-B + 20% Covered by Satellite ADS-B

Image Above: Radarbox ADS-B Coverage in China - 2016

Image Above: Radarbox ADS-B Coverage in China - 2021
Coverage Map
The coverage map also echoes the story of this tremendous growth. A majority of the country is covered by Ground-based ADS-B, with a few pockets of MLAT coverage. Ground-based ADS-B is complemented by ADS-C, HDFL, and Satellite-based ADS-B to achieve the remaining total route coverage.
Color Legend
- Light Green: ADS-B Coverage
- Dark Green: MLAT Coverage
- Yellow: ADS-C Coverage
- Purple: High-Frequency Data Link (HFDL) Coverage

Image Above: 2021 Radarbox China Coverage Map
FIR's in China
A flight information region (FIR) is a specific region of airspace where a flight information service and an alerting service are provided.
China has 10 FIR's. Namely, Beijing ACC, Zhuhai ACC, Guangzhou ACC, Wuhan ACC, Sanya ACC, Lanzhou ACC, Kunming ACC, Shanghai ACC, Urumqi ACC and Shenyang ACC. Of these 10 FIR's, 3 FIR's disproportionately see over 50% of air traffic in the country. The Radarbox Map has an option to show/hide ATC & FIR boundaries. Check it out below.

Image Above: ATC Boundaries / FIR's of China overlayed on the Radarbox map
Air Traffic Recovery in China
Most Chinese airports saw quick recoveries in air traffic (arrivals & departures) in the 3rd and 4th quarters of 2020 and almost all have recovered to pre-pandemic levels as of March 2021.
Stats & data for every Chinese airport can be viewed by simply searching for the airport using the search option (magnifier icon) and choosing Airport Page.
Click here to view commercial air traffic at 5 major Chinese airports - https://www.radarbox.com/statistics/airports/ZUUU

Image Above: Graph of Total Commercial Air Traffic at Shanghai's Pudong International Airport

Image Above: Total Departures & Arrivals at 5 Chinese Airports (Mar 9 - Mar 26)
Want to share data or feed for Radarbox?
Request for a FREE ADS-B Receiver here or build your own Raspberry Pi receiver here.
READ NEXT...
 78537
78537Tracking Helicopters With RadarBox
Today we'll explore how to filter and track helicopters on RadarBox.com. Read this blog post to learn more...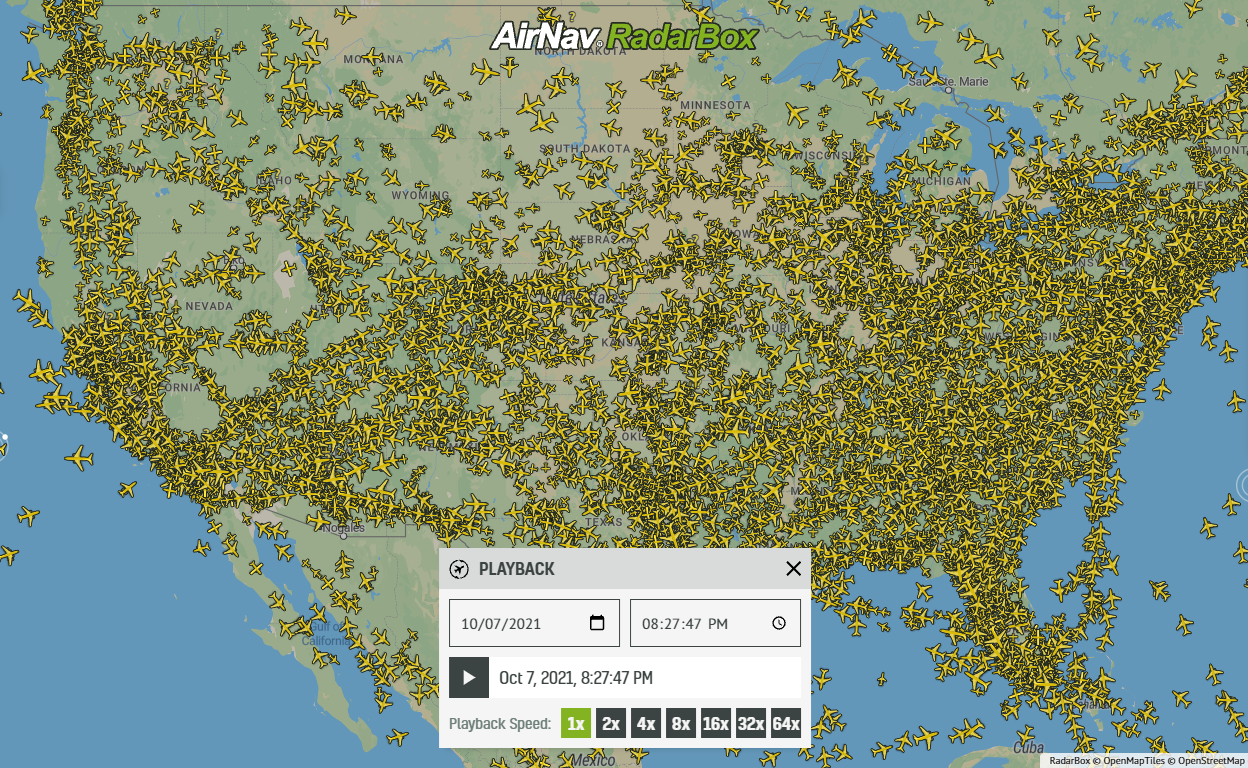 21776
21776Replay Past Flights with Playback
AirNav RadarBox officially launches the playback function on RadarBox.com, allowing users to replay the air traffic for a specific date and time in the past, within a 365-day period. Read our blog post to learn more about this feature. 14604
14604The King's Coronation: Tracking The Red Arrows on RadarBox.com!
Ahead of the King's Coronation on Saturday in the UK, find out how you can track the Red Arrows on RadarBox.com.