Global Commercial Air Traffic Records Double-digit Growth - Reaching 73% Pre-Pandemic Levels
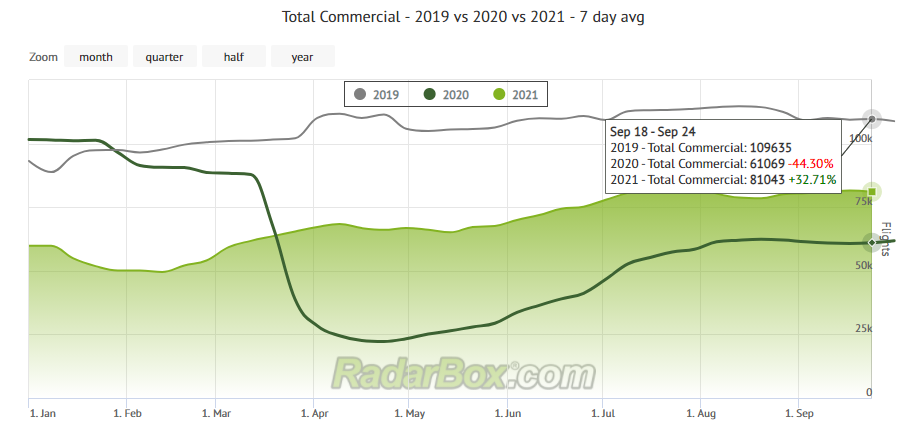
The Image Above: Global commercial flight statistics from September 18 to September 24 - RadarBox.com/statistics
Commercial air traffic worldwide has been registering positive results > 30% since the beginning of September this year, which evidences a recovery in commercial aviation worldwide as countries open their borders and relax health measures due to mass vaccination in many countries around the world.
According to AirNav RadarBox data during last week (September 18-24), our servers recorded 567,301 flights with a daily average of 81,043 commercial flights globally. These figures correspond to a growth of about +32.71% compared to the year 2020.
Regarding pre-pandemic levels (109,635 flights), these statistics correspond to 73% of commercial air traffic (81,043 flights) in the year 2019 before the COVID-19 pandemic. Relative to 2020, the number of flights during this period compared to the same period last year, commercial air traffic has seen an increase of 20,000 flights compared to the previous year.
2019: 767,445 flights (109,635) | 2020: 427,483 flights (61,069) | 2021: 567,301 flights (81,043)
Countries
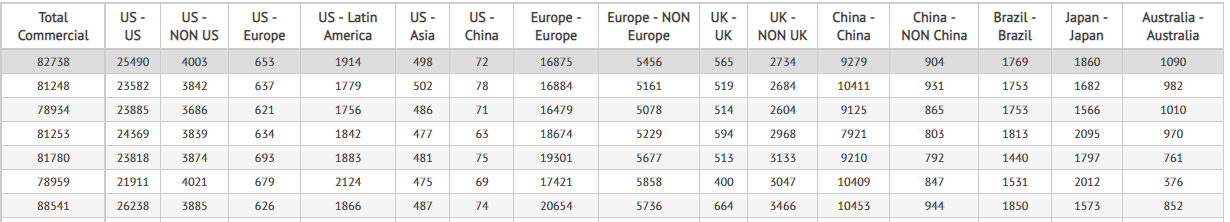
The Image Above: Recent commercial flight statistics from around the world via RadarBox.com
As well as viewing our flight statistics graphs, you can compare them. We emphasize as one of the factors for growth in global commercial air traffic:
1st - US - US : 169,293 flights (24,184 daily)
2nd - Europe - Europe: 126,288 flights (18,041 daily)
3rd - China - China: 67,258 flights (9,608 daily)
As we can see, global commercial air traffic is mainly driven by the world's top three domestic aviation: US, Europe, and China.
Airports
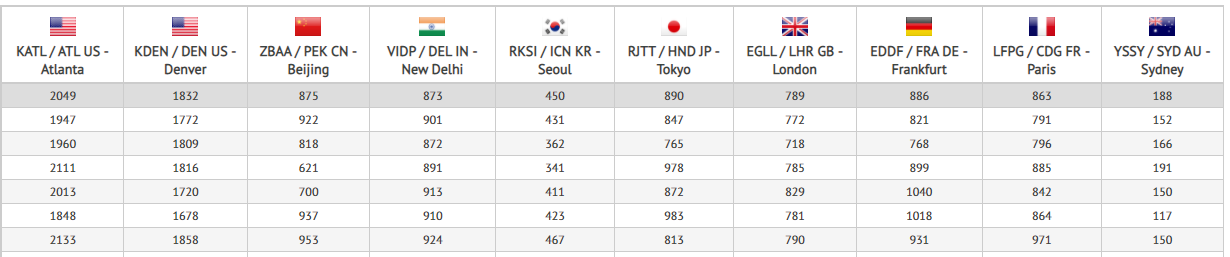
The Image Above: Recent airport movement statistics from around the world via RadarBox.com
Among the busiest airports, the top 3 are (September 18-24):
1st - Hartsfield–Jackson Atlanta International Airport: 14,061 flights (2,008 daily)
2nd - Denver International Airport: 12,485 flights (1,740 daily)
3rd - Indira Gandhi International Airport: 6,284 flights (897 daily)
Airlines
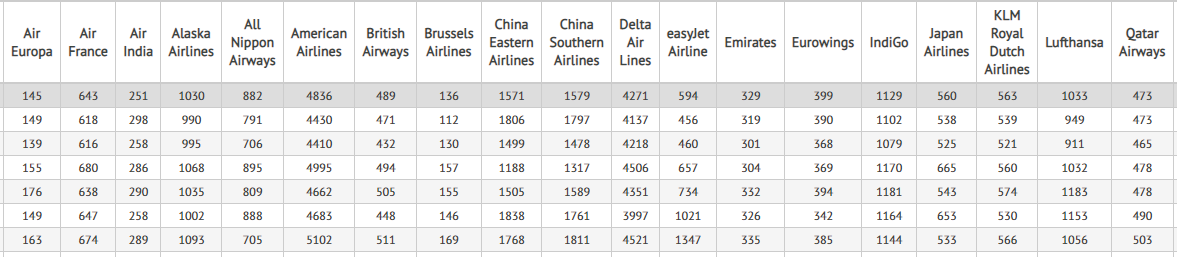
The Image Above: Recent statistics for airlines around the world via RadarBox.com
The top three airlines during September 18-24 were respectively:
1st - American Airlines: 33,118 flights (8,279 daily)
2nd - Delta Air Lines: 30,001 flights (4,285 daily)
3rd - United Airlines: 23,336 flights (3,333 daily)
Conclusion
Beijing Capital International Airport's route heatmap reveals that among the seven most popular routes in the country, all are airports located in China which evinces strong recovery and growth in China due to domestic flights.
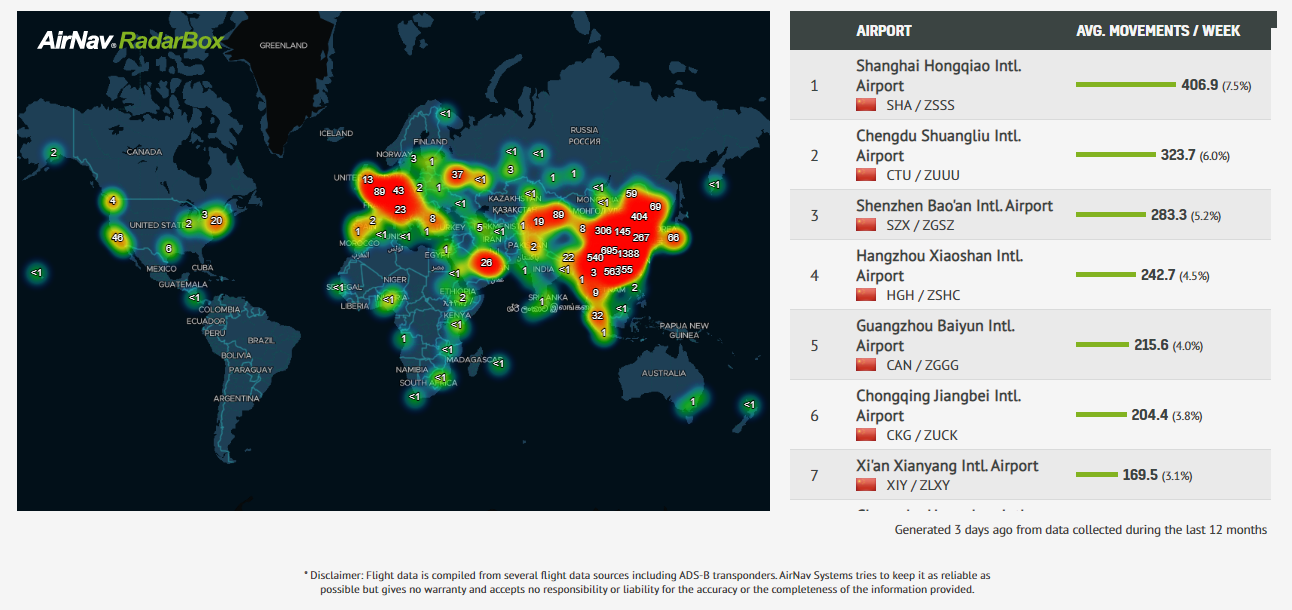
The Image Above: Beijing Capital International Airport (PEK/ZBAA) route heatmap on RadarBox.com
On the other hand, American Airlines' route heatmap shows that the most flown routes by the Dallas-based airline are in the US. Among the busiest routes, Chicago, Dallas, and Charlotte are considered as the ten busiest airports in the USA.
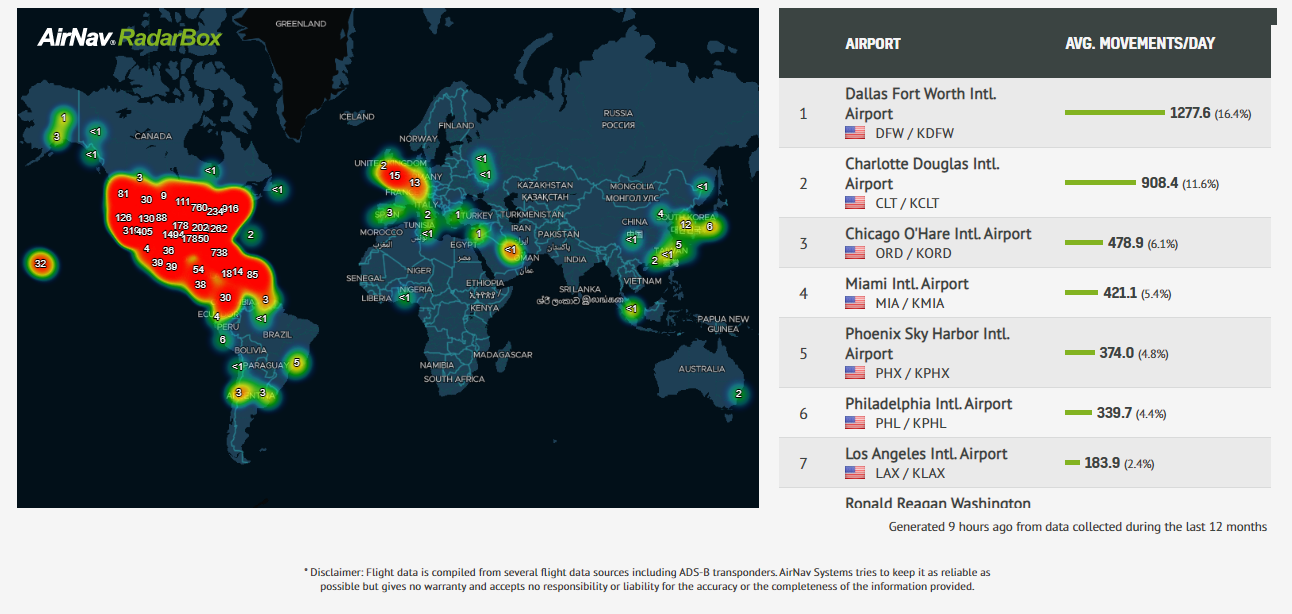
The Image Above: American Airline's route heatmap on RadarBox.com
For both, the importance of domestic air traffic is highlighted and corroborated for such growth. In Europe, due to the proximity of the nations, air traffic within the continent has aided in boosting global commercial air traffic.
Find these and other exclusive flight statistics at - Radarbox.com/statistics
READ NEXT...
 78078
78078Tracking Helicopters With RadarBox
Today we'll explore how to filter and track helicopters on RadarBox.com. Read this blog post to learn more...- 30312
AirNav Announces Coronavirus Related Data & Graphics Available
AirNav Systems is providing data COVID-19 air traffic related data for analysis, study and use. 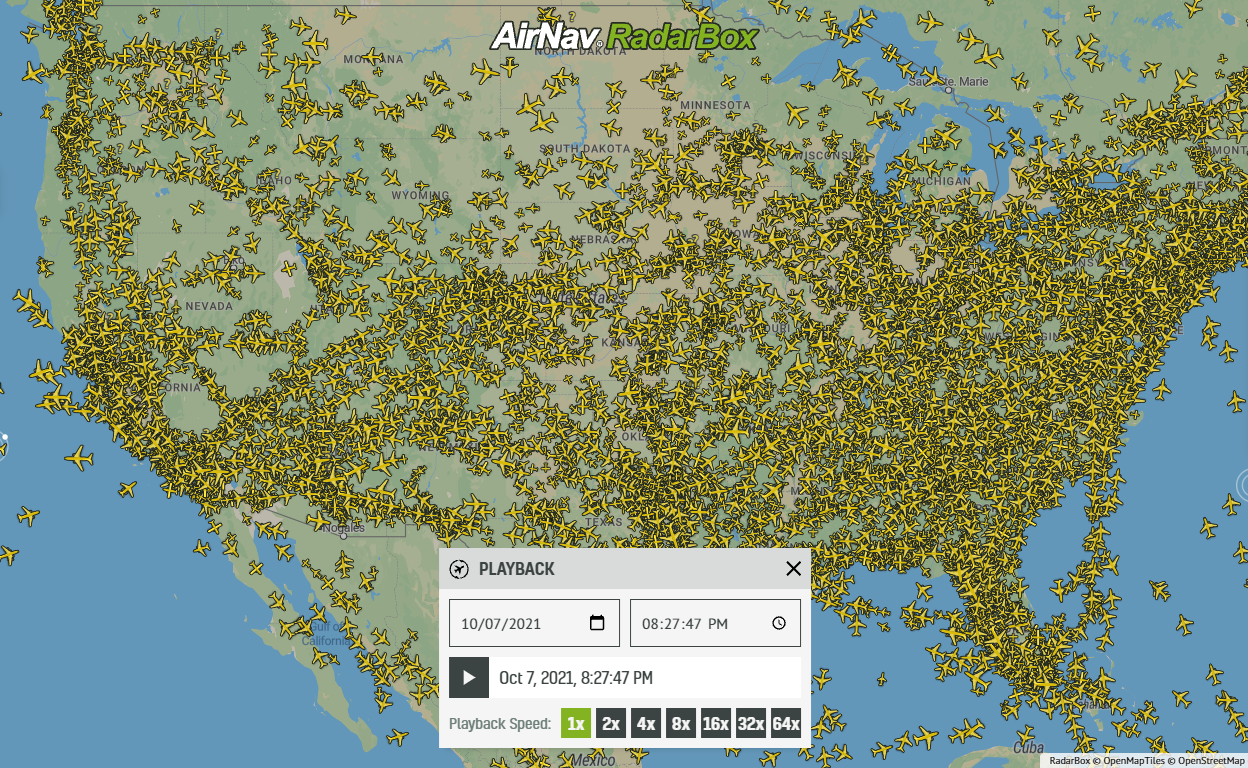 21670
21670Replay Past Flights with Playback
AirNav RadarBox officially launches the playback function on RadarBox.com, allowing users to replay the air traffic for a specific date and time in the past, within a 365-day period. Read our blog post to learn more about this feature.